01
Power BI Dashboards
Clarity at a glance, without the manual chase.
- Automated refresh
- Interactive visuals
- KPI tracking
- E-commerce, finance & operations
Reporting that works harder
We help businesses eliminate manual reporting and unlock clarity through automated dashboards, streamlined data flows, and monthly insights.
What we build
From a oneoff dashboard build to a monthly reporting rhythm, every solution is designed to remove friction and reveal the decisions that matter.
Clarity at a glance, without the manual chase.
Reliable reporting flows that give your team time back.
A reporting partner for sharper decisions, every month.
See the opportunity
Discover how much time and money your organisation could save by automating manual reporting processes.
Adjust the figures to see an indicative annual opportunity for your team.
Manual Reporting Costs
£30,000per yearPotential Annual Saving
£24,000estimated opportunityHours Recovered
1,200hours per yearEstimated ROI
80%automation potentialSelected work
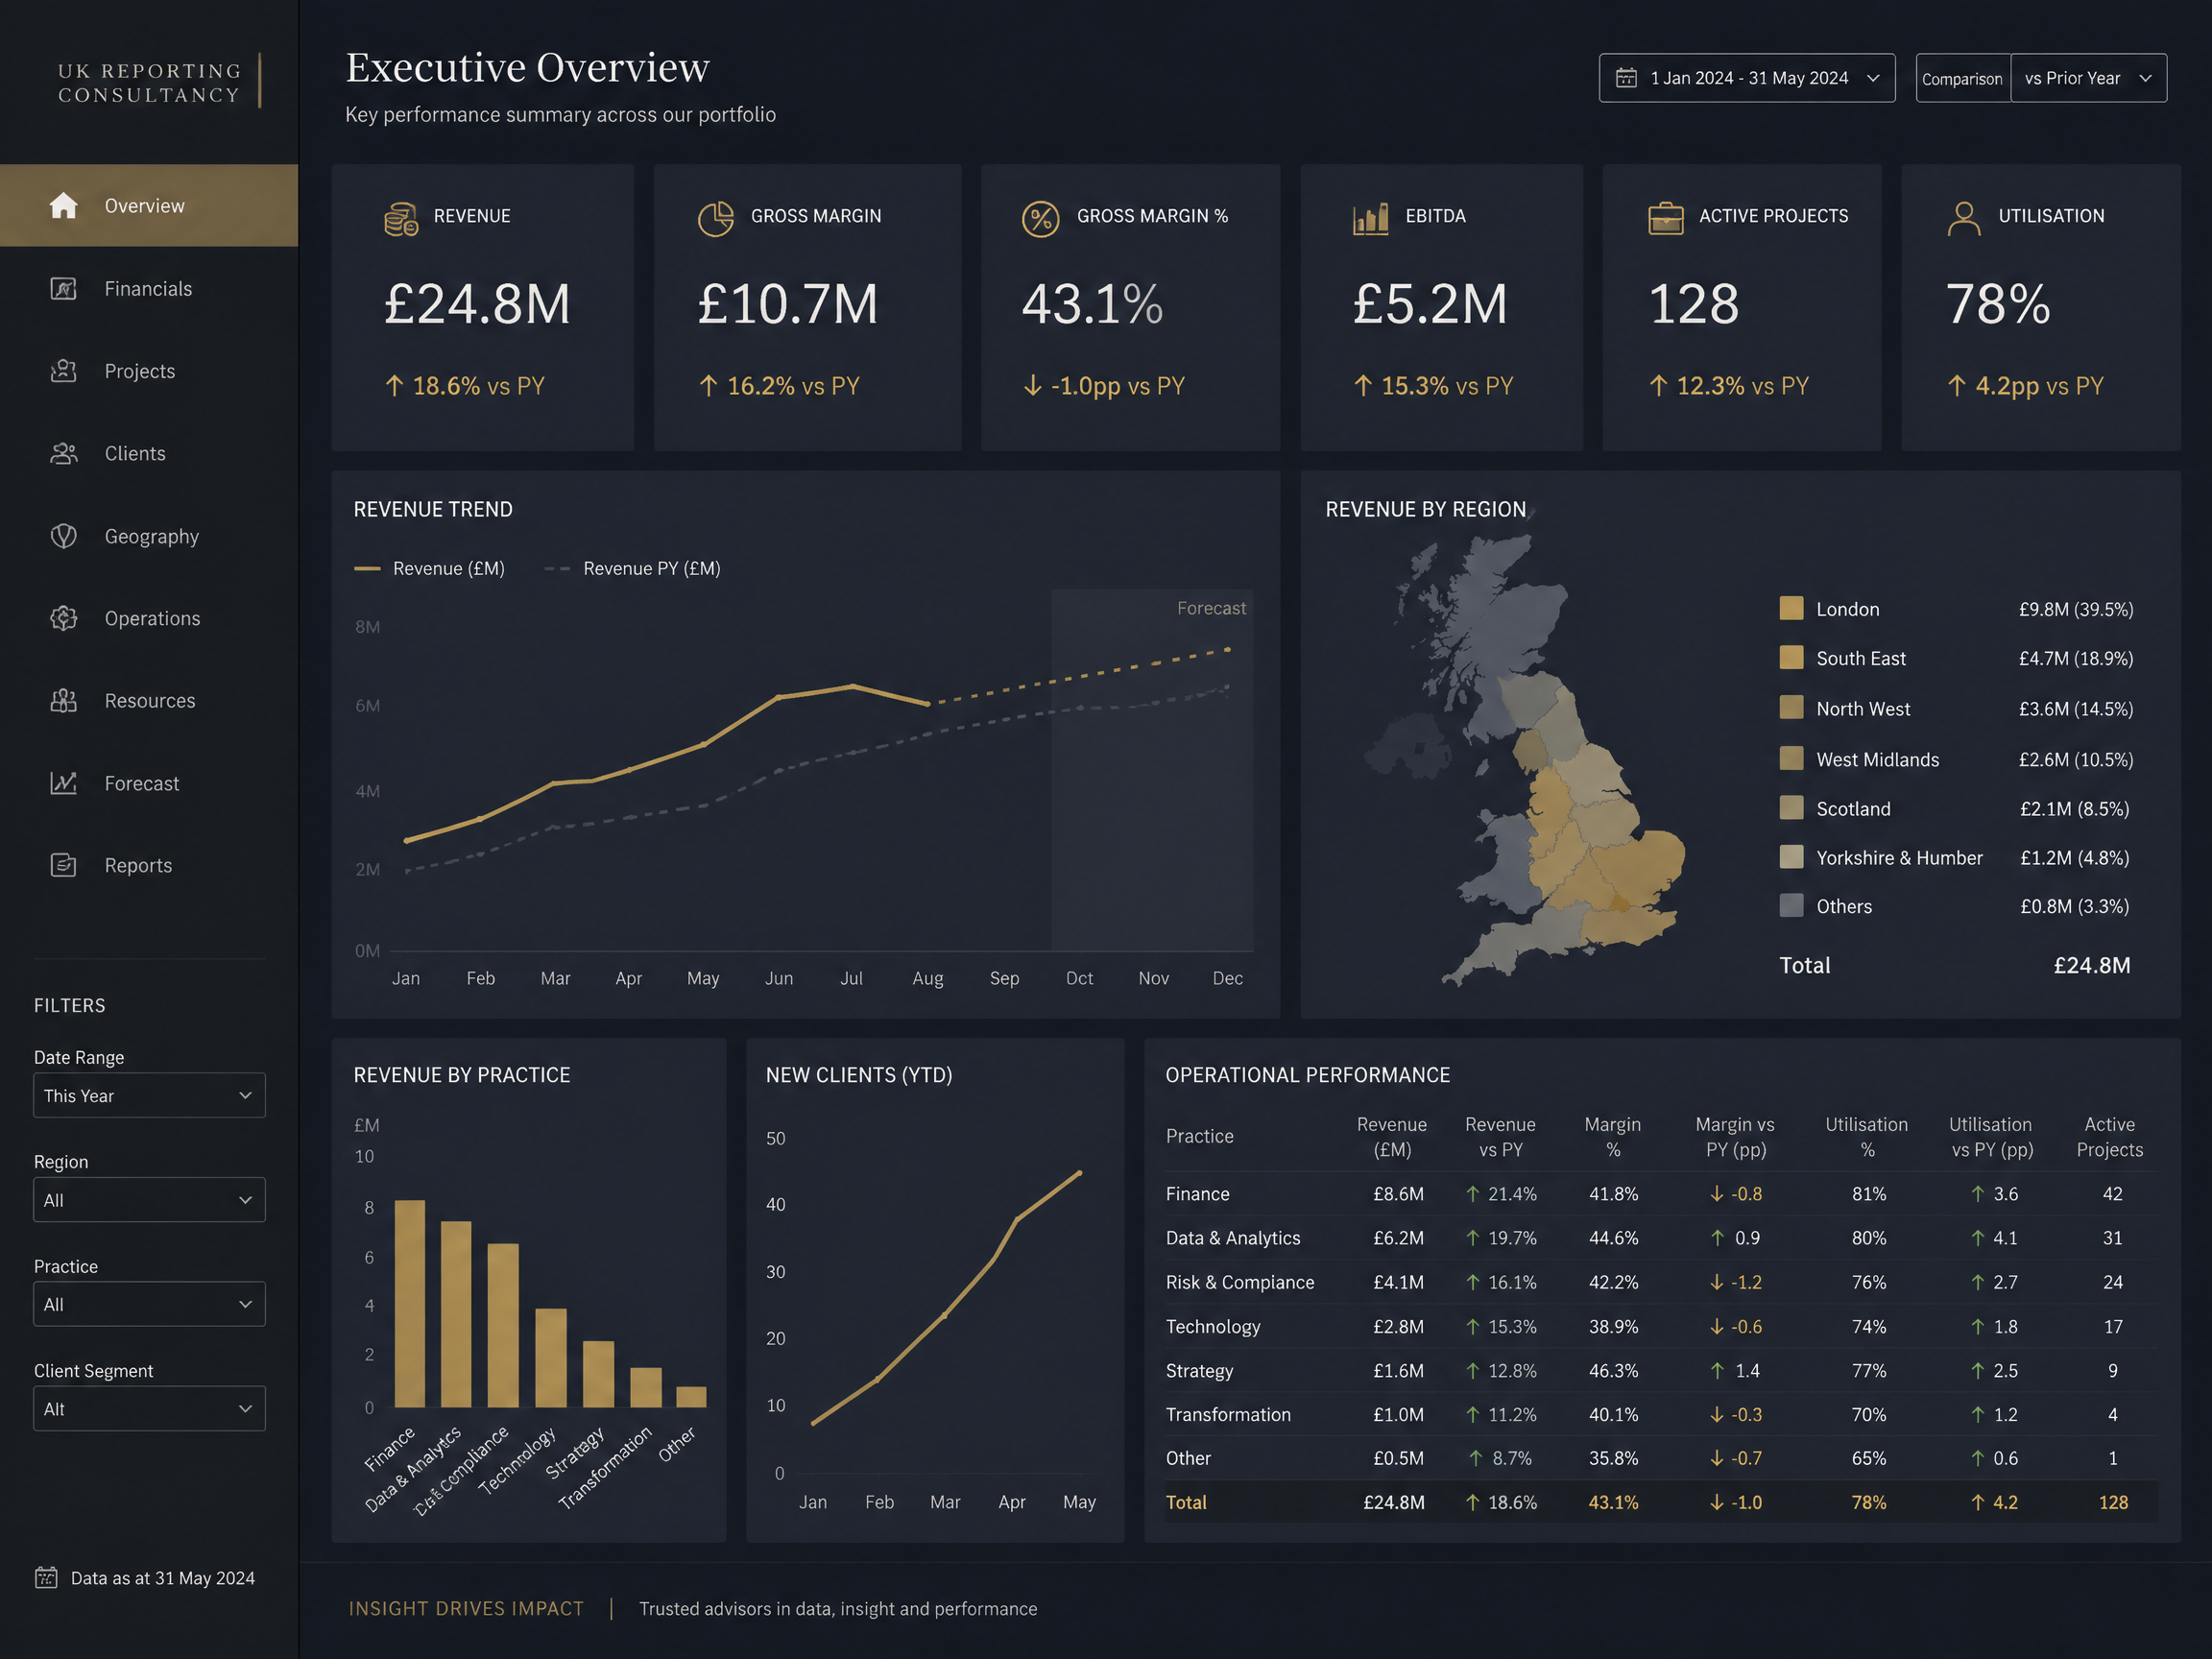
A single view across commercial KPIs, operating performance, and regional trends.
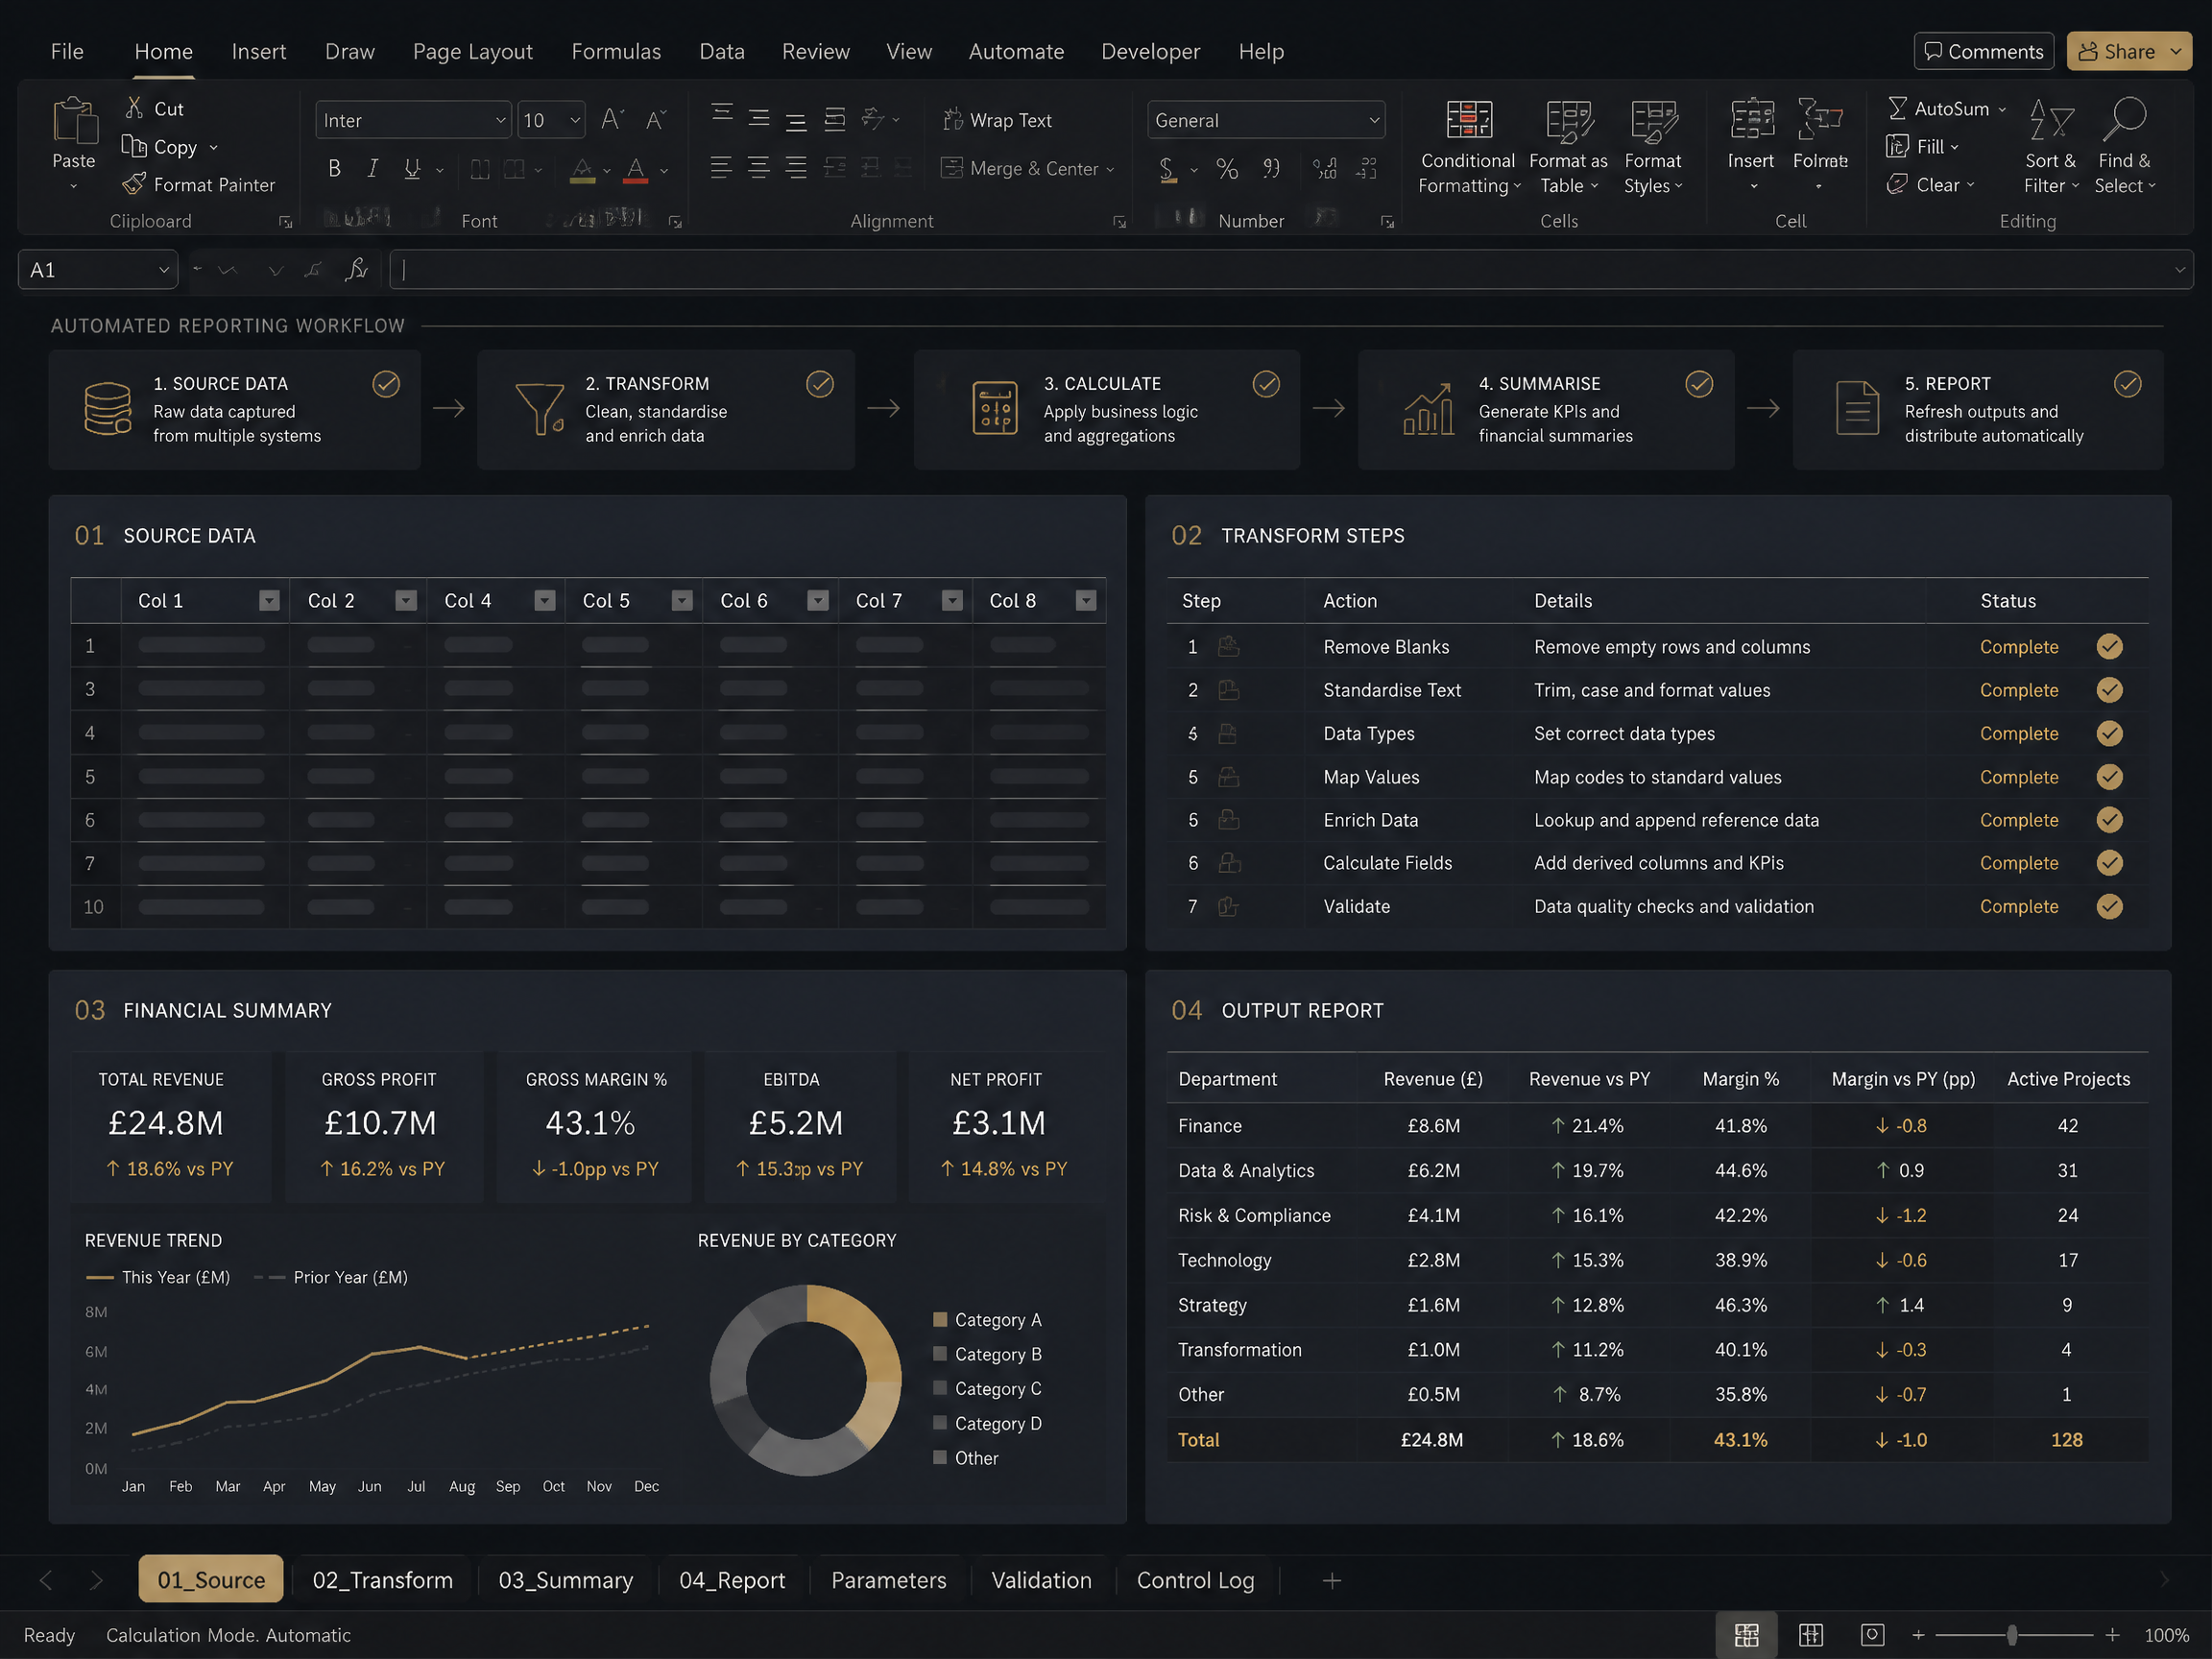
Source data, repeatable transformations, and a clean monthly output in one dependable flow.
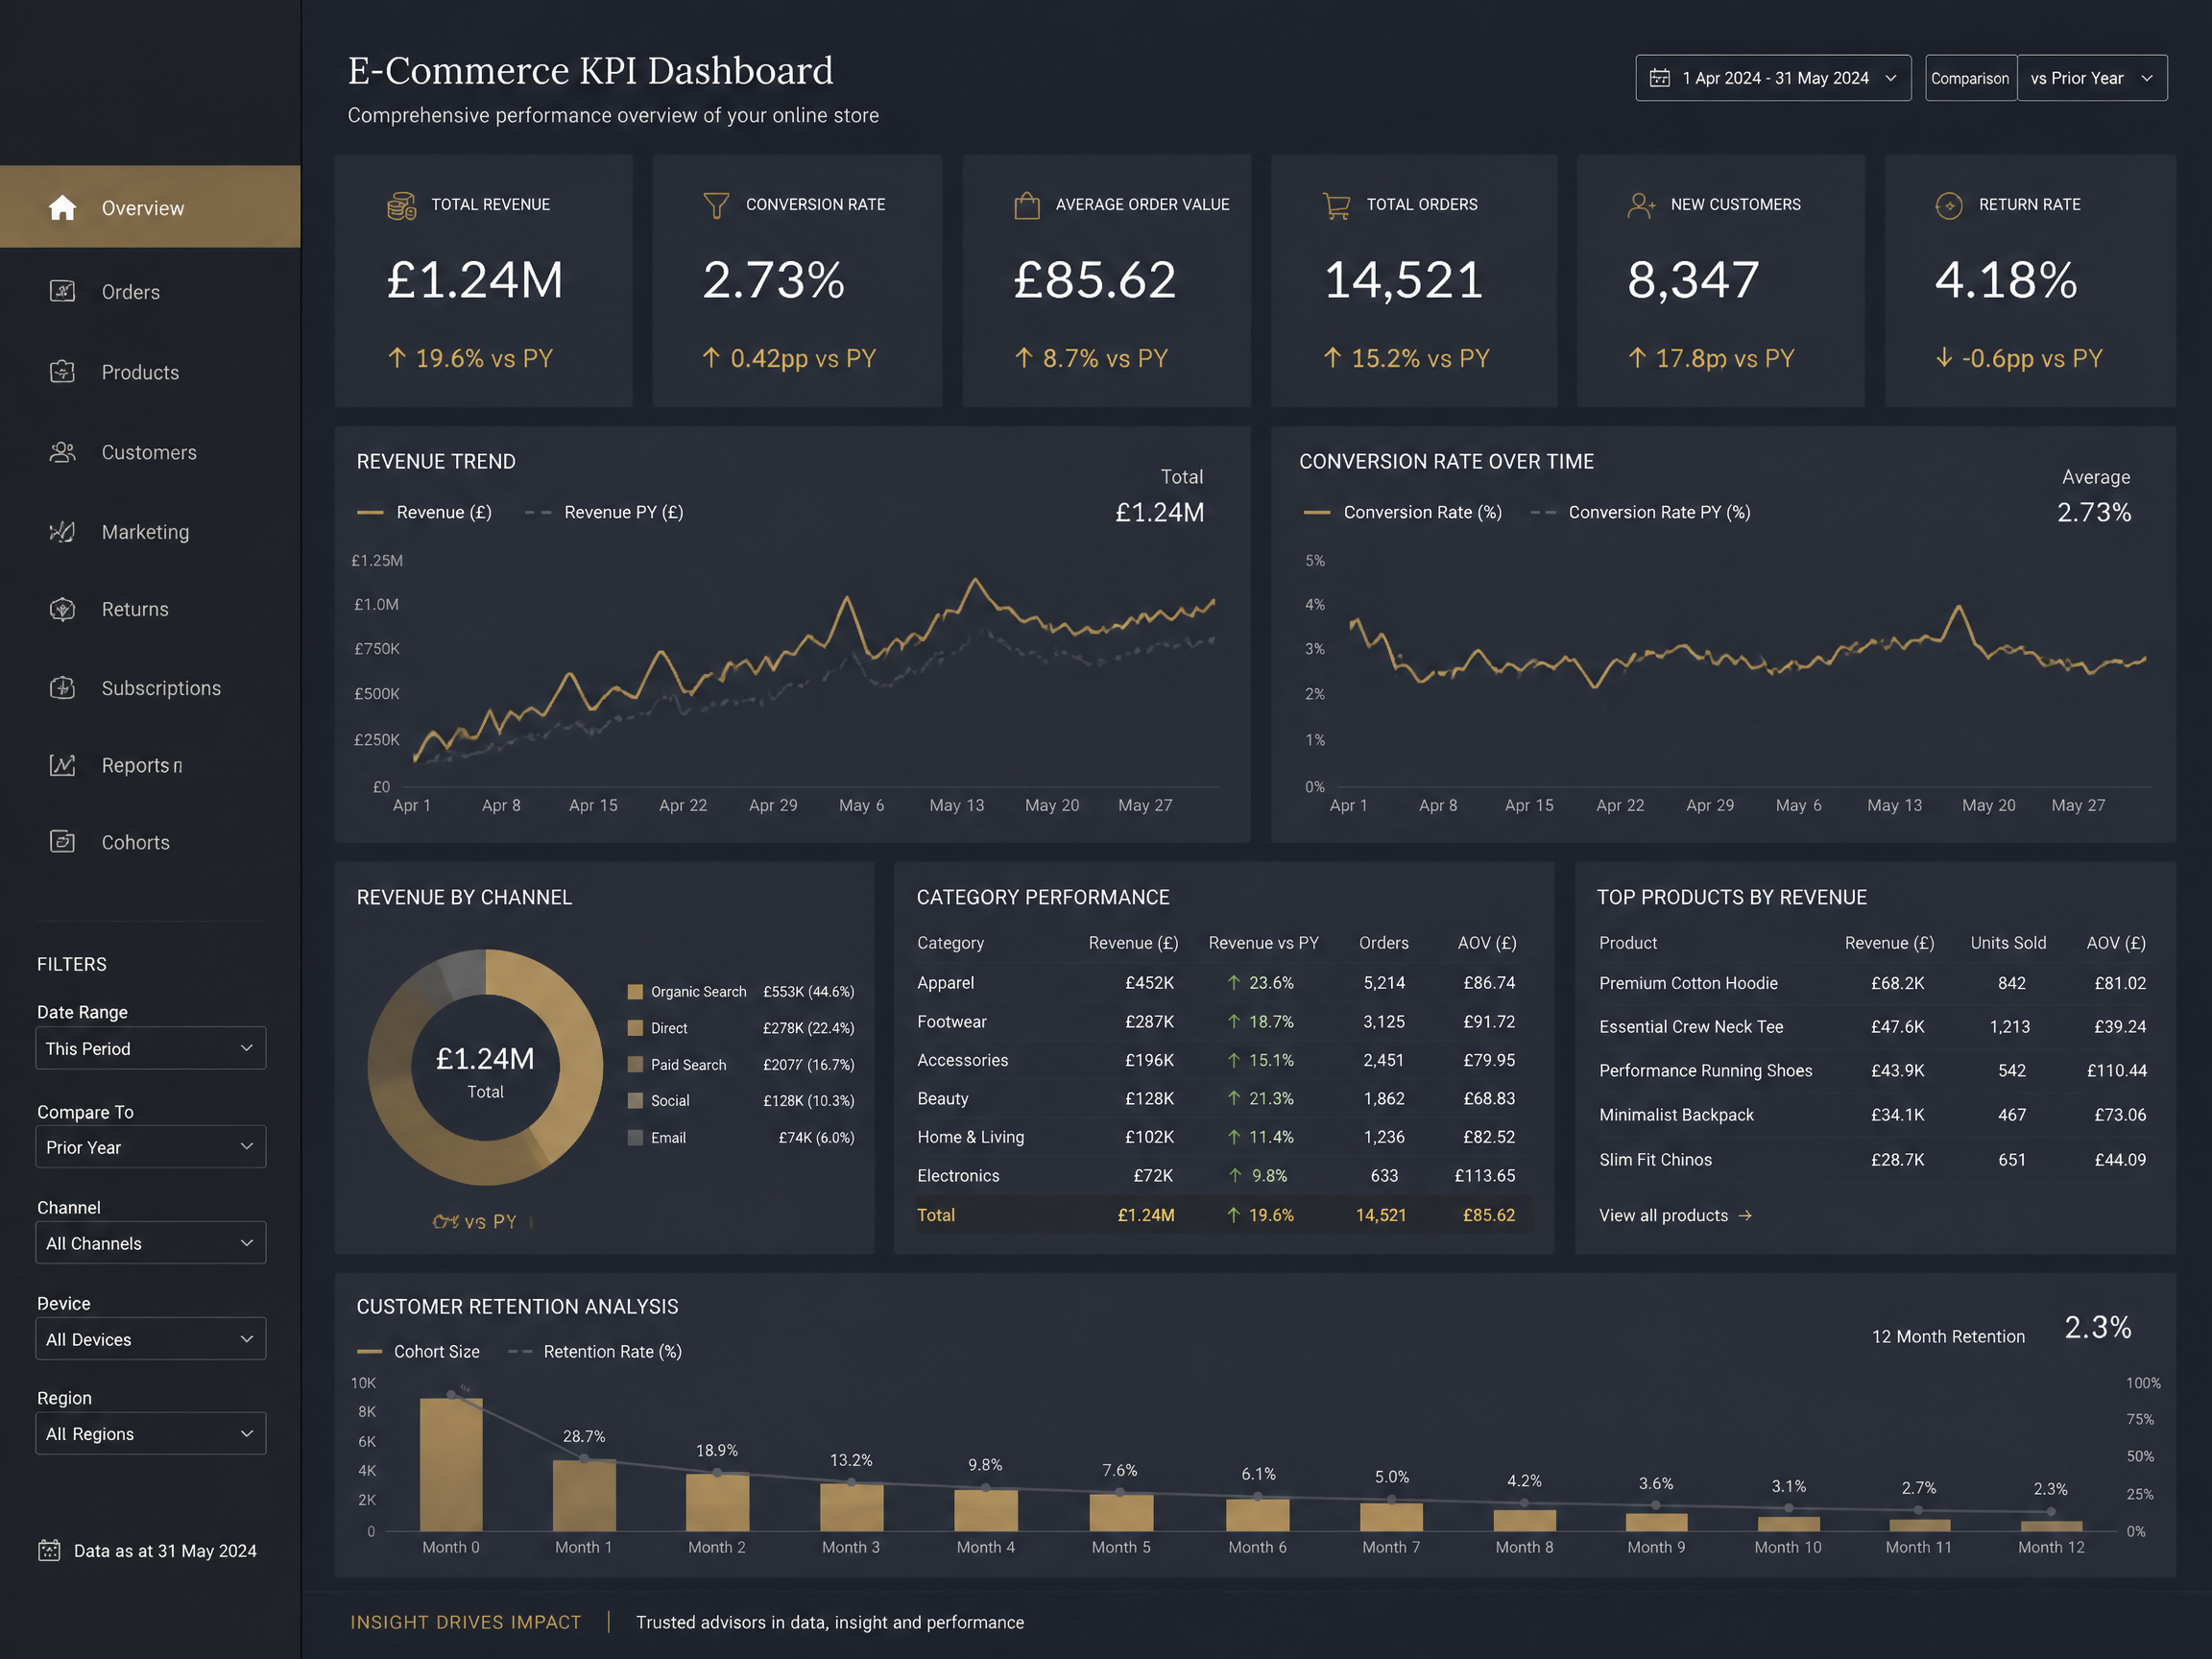
Daily trading insight for revenue, conversion, customer retention, and category performance.
The process
Free reporting review
Clear scope + timeline
Dashboard + automation setup
Monthly insights + improvements
Simple, considered pricing
from £400/month
Monthly reporting + dashboard refresh
Most popular
from £600/month
Reporting + automation + insights
from £900/month
Full reporting suite + forecasting + optimisation
Dashboard builds start at £750–£2,000 depending on complexity.
About Data Driven Consultants
We are Data Driven Consultants, data analysts specialising in automated reporting solutions. With 15 years of Excel experience, 10 years in Power BI, and a background working with local councils, SMEs, large organisations and agencies, we help businesses eliminate manual reporting and make better decisions through automated dashboards and streamlined data flows.
A better reporting rhythm starts here
Book a free audit and discover how much time your business can save.